New way to track keywords rank
21:38This post covers how I create and use rank indexes and introduces a new and improved way to track rank in Google Analytics.
Rankaggedon
In December of 2012 both Raven and Ahrefs made the decision to shut down their rank tracking features because they violated Google’s Terms of Service. The reaction from the SEO industry was predictable.

The debate about why Google began to enforce the TOS (I think it has to do with the FTC investigation) and the moaning about how unfair it is doesn’t interest me. BothSEOmoz and Authority Labs still offer this service and the way many use rank needs to change anyway. Every obstacle is an opportunity. Trite but true.
Is Rank Important?
To be honest, I don’t use rank that much in my work. This has to do with a combination of the clients I choose to work with and my philosophy that increasing productive traffic is the true goal.
Yet, you’d have to be soft in the head not to understand that securing a higher rankdoes produce more traffic. Being on the first page matters. Getting in the top three results can produce significant traffic. Securing the first position is often a huge boon to a business. Duh!
But rank is the extrinsic measurement of your activities. It’s a Google grade. Rank isn’t the goal but the result.
Unfortunately, too many get obsessed with rank for a specific keyword and spendway too much time trying to move it just one position up by any means necessary. They want to figure out what the teacher is going to ask instead of just knowing the material cold.
Rank Indexes
So how do I use rank? I create rank indexes.
A rank index is the aggregate rank of a basket of keywords that represent a type of query class that have an impact on your bottom line. For an eCommerce client you might have a rank index for products and for categories. I often create a rank index for each modifier class I identify for a client.
Usually a rank index will contain between 100 and 200 keywords that represent that query class. The goal is to ensure that those keywords reflect the general movement of that class and that changes in rank overall will translate into productive traffic. There’s no sense in measuring something that doesn’t move your business. If that rank index moves down (lower is better) then you know your efforts are making a difference.
Executives Love Indexes

A rank index is also a great way to report to C Level executives. These folks understand index funds from an investment perspective. They get this approach and you can steer them away from peppering you with ‘I did this search today and we’re number 4 and I want to be number 1′ emails. It becomes not about any one term but the aggregate rank of that index. That’s a better conversation to have in my opinion.
A rank index keeps the conversation on how to move the business forward instead of moving a specific keyword up.
Getting Rank Index Data
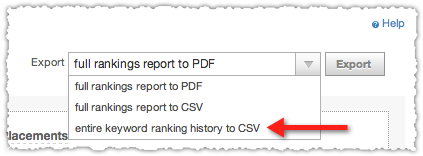
If you’re using SEOmoz you export the entire keyword ranking history to CSV.
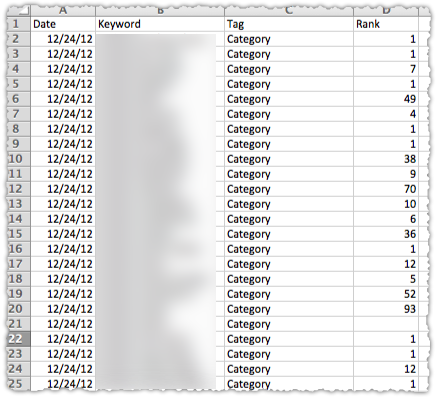
After a bit of easy clean up you should have something that looks like this in Excel.
At this point I simply copy and paste this data into my prior framework.
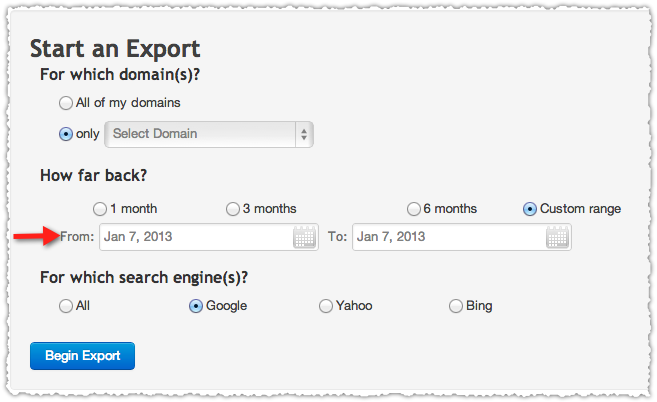
I’ve already configured the data ranges in that framework to be inclusive (i.e. – 50,000 rows) so I know that I can just refresh my pivot table and everything else will automagically update. If you’re using Authority Labs you’ll want to export a specific date and simply perform the export each week.
There’s a bit more clean up for Authority Labs data but in no time you get a clean four column list.
Unlike the SEOmoz data where you replace the entire data in your framework, you simply append this to the bottom of your data. Once again, you know the pivot table will update because the data range has been configured to be quite large.
Creating The Rank Index Pivot Table
You can review my blow by blow of how to create a pivot table (though I’m not using a new version of Excel so it all looks different anyway.) It’s actually a lot easier now than it was previously which is something of a miracle for Microsoft in my view. You’ll use the keyword as your row label, date as the column label and the Average of rank as the values. It’s important to use a label so you can create different indexes for different query classes. Even if you only have one index, use a label so you can use it as a filter and get rid of the pesky blank column created by the empty cells in your data range.
You may notice that there are a lot of 100s and that is by design.
All those non-ranked terms need to be counted somehow right? I chose to use 100 because it was easy and because Authority Labs reports up to (and sometimes beyond) that number.
Turning Rank Data Into A Rank Index
Now that you have all the rank data it’s time to create the rank index and associated metrics.
Below the pivot table it’s easy to use a simple AVERAGE function as well as various COUNTIF functions to create these data points. Then you can create pretty dashboard reports.
Average Rank is the one I usually focus on but the others are sometimes useful as well and certainly help clients better understand the situation. A small caveat about the Average Rank. Because you’re tracking non-ranking terms and assigning them a high rank (100) the average rank looks a bit goofy and the movement within that graph can sometimes be quite small. Because of this you may wind up using the Average of Ranking Terms as your presentation graph.
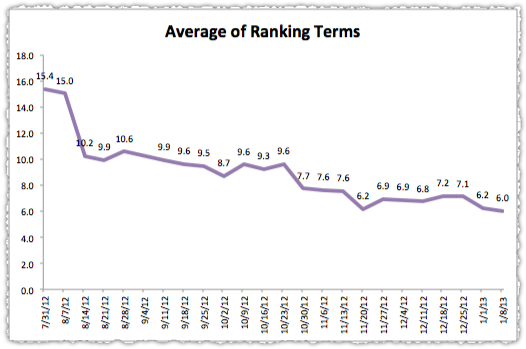
I don’t care much about any individual term as long as the index itself is going in the right direction.
Projecting Traffic
I can always look at the details if I want and I’ve also created a separate tab which includes the expected traffic based on the query volume and rank for each term.
This simply requires you to capture the keyword volume (via Google Adwords), use a click distribution table of your choosing and then do a VLOOKUP.
IFERROR(([Google Adwords Keyword Volume])*(VLOOKUP([Weekly Rank],[SERP Click Distribution Table]),2,0)),0)
You’ll need to divide by 4 to get the weekly volume but at that point you can match that up to real traffic in Google Analytics by creating a regex based advanced segment using the keywords in that index. Of course, you have to adjust for (not provided) and the iOS attribution issue so this is very far from perfect. And that’s what got me really thinking about whether rank and rank indexes could be relied on as a stable indicator.
What is Rank?

The rise in (not provided) and the discrepancies often seen between reported rank volume and the traffic that shows up point to the increase in personalization. SERPs are no longer as uniform as they once were and personalization is only going to increase over time.
So you might have a ‘neutral’ rank of 2 but your ‘real’ rank (including context and personalization) might be more like a 4 or 5.
That’s why Google Analytics rank tracking seems so attractive, because you can get real world ranking data based on user visits. But that method is limited and makes reporting a huge pain in the ass. The data is there but you can’t easily turn it into information … until now.
Improved Google Analytics Rank Tracking
I got to talking to Justin Cutroni (a really nice and smart guy) about the difficulties around tracking rank in Google Analytics. I showed him how I use rank indexes to better manage SEO efforts and over the course of a conversation (and a number of QA iterations) he figured out a way to deliver keyword rank the way I wanted in Google Analytics.
Using Events and the value attached to it, we’ve been able to create real keyword rank tracking in Google Analytics.
The Avg. Value is calculated by dividing the Event Value by Total Events. You could change this calculation once you do the export to be Event Value by Unique Events if you’re concerned about those users who might refresh the landing page and trigger another Event. I haven’t deployed this on a large site yet to know whether this is a real concern or not. Even if it is, you can always change it in the export.
So you can just make Avg. Value a calculated field and then continue to tweak the exported data so that it’s in a pivot table friendly format. That means adding a date column, retaining the Event Action column but renaming it keyword, adding a Tag column, and retaining the Avg. Value column. You essentially want it to mimic the four column exports from other providers. I suppose you could keep a bunch of this stuff in there and not use it in the pivot table too. I just like it to be clean.
Event Based Rank Tracking Code
Start tracking rank this way on any Google Analytics enabled site by dropping the following code into your header.
To make it easier, the code can be found and copied at jsFiddle. Get it now! Just like the old method of tracking rank in Google Analytics, this method relies on finding the cd parameter (which is the actual rank of that clicked result) in the referring URL. This time we’re using Event Tracking to record rank and putting it in a field which treats it as a value. The code has also been written in a way to ensure it does not impact your bounce rate. So there’s no downside to implementation. You will find the data under the Content > Events section of Google Analytics.
Just click on Content, Top Events and then RankTracker and you’ll find keyword ranking data ready for your review.
Google Analytics Rank Indexes
I’ve been working at applying my index approach using this new Event based Google Analytics rank tracking data. The first thing you’ll need to do is create an advanced segment for each index.
You do this by creating a regex of the keywords in that index. Sometimes you might not get a click on a term that is ranked 20th and certainly not those that are ranked 50th. That’s a constraint of this method but you can still populate an entire list of keywords in that index by doing a simple VLOOKUP.
IFERROR(VLOOKUP(A1,'Export Event Data'!$A$1:$E$5000,5,FALSE),100)
The idea is to find the keyword in your export data and report the rank for that keyword. If the keyword isn’t found, return a value of 100 (or any value you choose). From there it’s just about configuring the data so you can create the pivot table and downstream reports.
Caveats

This new way of tracking is different and has some limitations. So lets deal with those head on instead of creating a grumble-fest.
The coverage isn’t as high as I’d like because of (not provided) and the fact that the cd parameter is still only delivered in about half of the referrers from Google. I’m trying to find out why this is the case and hope that Google decides to deliver the cd parameter in all referrers.
Full coverage would certainly increase the adoption of rank tracking in Google Analytics and reduce those seeking third party scraped solutions, something Googlereally doesn’t like. It’s in their self-interest to increase the cd parameter coverage. As an aside, you can get some insight into the rank of (not provided) terms and match those to landing pages, which could be pretty useful.
The other limitation is that you only get the rank for those queries that received clicks. So if you’re building a rank index of terms you want to rank for but aren’t and track it over time it becomes slightly less useful.
Though as I’ve shown above you can track the average of ranking terms and of the index as a whole at the same time. One of the better techniques is to find terms that rank at 11 to 13 and push them up to the front page, usually with some simple on-page optimization. (Yes, seriously, it’sway more effective than you read about.)
So this type of tracking might miss a few of these since few people get to page 2 of results. Then again, if you see a rank of 11 for a term with this tracking that’s an even higher signal that getting that content to the front page could be valuable. Finally, the data configuration is, admittedly, a bit more difficult so you’re working a tad harder to get this data. But on the other hand you’re seeing ranking data from real users. This could get really interesting as you apply geographic based advanced segments. Larger organizations with multiple locations might be able to determine which geographies they rank well in versus those where they’re struggling.
And not Or
At this point I can’t say that I’d scrap traditional rank tracking techniques altogether, though I’m sure Google would like me to say as much. Instead, I think you should use the new Google Analytics Event Based Rank Tracking in conjunction with other ranking tools.
First off, it’s free?
So there’s no reason not to start using it. Second, you get to see real world rank, which while limited in scope can be used to compare against neutral rank offerings. Lastly, if you’re trying to future proof your efforts you need to be prepared for the potential end to traditional ranking tools or such high variation in personalization to make them unreliable. Did I mention this new rank tracking method is free? I’m looking forward to putting this into practice and comparing one tracking method to the other. Then we’ll see the potential variance between personalized ranking versus anonymized ranking.
TL;DR
The closure of recent third-party rank tracking services is an opportunity to think about rank in a different way. Using a rank index can help keep you focused on moving the business forward instead of a specific keyword. To future proof your efforts you should implement improved Google Analytics rank tracking for free.


0 nhận xét: